Medical Sequencing Data
Medical Sequencing Data
Some combination of phenotype and genotype ... Details unknown. Worthwhile to design ?
Major Types of information
- Subjects
- Anonymous individuals
- Family history
- Age
- Sex
- Ethnicity
- Pools of people
- Anonymous individuals
- Environmental data
- Location (zip code would be great)
- Medications they are taking
- Exercise, nutrition ...
- Genotype info
- Microarray based
- SNPs
- Haplotype blocks
- Copy number polymorphism
- Sequence based
- Random reads
- PCR products
- larger clones
- single haplotype vs. diploid
- Microarray based
- Phenotype
- Disease presence/absence or severity
- ADR - Adverse Drug Reaction
- Single physiological measure
- Enzyme activity, measure of amount of substance
- Parallel Measures
- Microarray measurements, etc...
Some Other Database Entities
- GenotypeTest - records what regions of genome probed.
- Study
- External URL
- Publications
- Contacts
- A group of subjects
- A set of phenotype and genotype tests
Existing Genotype/Phenotype Web Databases
http://www.pharmgkb.org/ - Requires registration for much data. Fan & Jim registered
http://globin.bx.psu.edu/genphen/ - Belinda, Ross and Webb's work, mostly covers hemoglobins
http://www.hgvs.org/dblist/dblist.html - Variation Databases and Related Sites, updated 3/31/06 on HGVS (Human Genome Variation Society)
Some Relevant Papers
http://www.pubmedcentral.gov/picrender.fcgi?artid=1271381&blobtype=pdf - Recent large Parkinson's SNP association study. http://www.ncbi.nlm.nih.gov/entrez/query.fcgi?cmd=Retrieve&db=pubmed&dopt=Abstract&list_uids=16642434&query_hl=11&itool=pubmed_DocSum - Some statistical techniques for studies involving related and unrelated people. http://www.ncbi.nlm.nih.gov/entrez/query.fcgi?cmd=Retrieve&db=pubmed&dopt=Abstract&list_uids=16607626&query_hl=11&itool=pubmed_DocSum - Some theory of two stage study design for full-genome genotyping screens. http://www.ncbi.nlm.nih.gov/entrez/query.fcgi?cmd=Retrieve&db=pubmed&dopt=Abstract&list_uids=16607624&query_hl=11&itool=pubmed_DocSum - More statistical techniques, addressing in particular non-normal distribution of quantitative traits in patient populations. http://www.pubmedcentral.gov/picrender.fcgi?artid=1435944&blobtype=pdf - A web based tools for picking candidate SNPs to study for a particular disease. http://www.biomedcentral.com/content/pdf/1471-2156-6-S1-S89.pdf - Examines utility of genome-wide linkage vs. SNP association studies in the context of a scan for alcoholism susceptibility. http://www.pubmedcentral.gov/picrender.fcgi?artid=1182008&blobtype=pdf - Looks at SNP linkage vs. microsatelites in a genomic scan for genes involve in rheumitoid arthritis. http://www.ncbi.nlm.nih.gov/entrez/query.fcgi?cmd=Retrieve&db=pubmed&dopt=Abstract&list_uids=15069025&query_hl=25&itool=pubmed_DocSum - 2 stage study of 552 affected/unaffected sibling pairs for multiple sclerosis. Stage 1 - 498 microsatilite markers, Stage 2 - more detailed genotyping in regions suggested by stage 1.
Mock Up of Phenotype Sorter
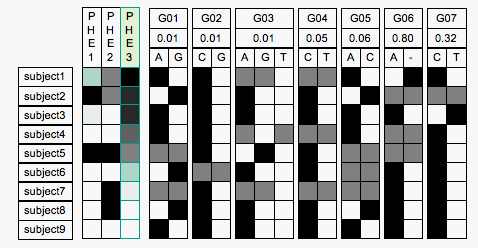
The Phenotype Sorter would be a web-based application aimed at presenting the full details of phenotype and genotype. The sorter has a line for each individual, and a column for each phenotype assayed in a study, and also a column for each genomic locus assayed in a study. The rows are sorted according the value of a selected phenotype, phe3 in the image above, which is indicated by a green hilight. (Ignore the green box in the first row of phe1, it seems to be an artifact of the conversion from TIF to GIF).
The genotype columns are divided into a subcolumn
for each allele, and at least for the simple nucleotide polymorphisms the alleles are labeled with the associated nucleotide. The number in the second row of the genotype label represents the strength of the locus as a marker for the phenotype. Possibly when sorting the rows by phenotype we should also sort the columns based on this number, though I was thinking of sorting the genotype columns just by position in genome initially.
Mock Up of Genotype/Phenotype Track
 The Genotype/Phenotype track would show information from a variety of studies. It would not (at least in the default modes) show subject-by-subject information. Instead it would show the 'marker association probability' at each of the positions assayed in the study. As depicted here it is showing the probability in a little bar graph. The horizontal baseline of the graph serves to link together all the positions assayed. I've grouped studies together using background, but I'm not sure if this will actually work in the genome browser context, and perhaps we could dispense with this. I'm sure it will be a struggle, as it has been with ENCODE, to come up with good 16 letter labels, but if we are able to do this, it should be clear enough.
