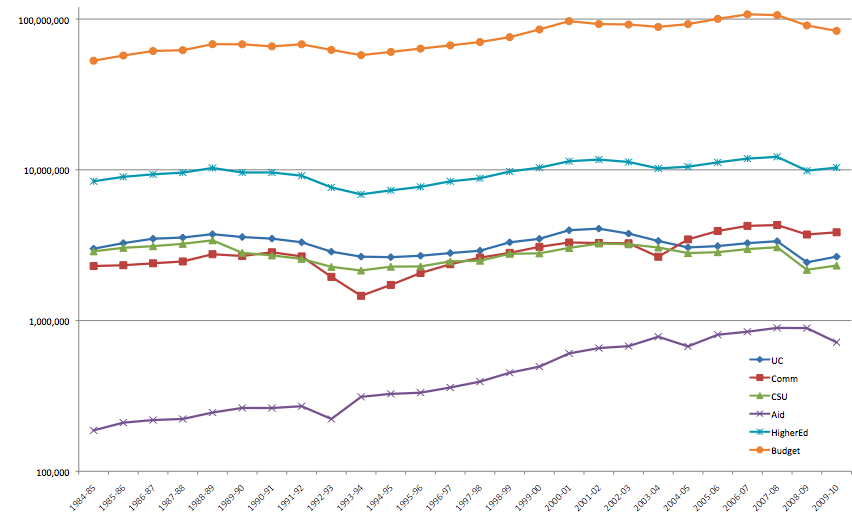
California Higher Education Budget
From genomewiki
Jump to navigationJump to search
Numbers collected from spread sheet available at:
California Historical Budgets
Consumer Price Index factor obtained from:
Bureau of Labor Statistics Inflation Calculator
The four categories: UC system, Comm Colleges, CSU and Student Aid are the
highest four categories in the budget category of "Higher Education"
within the full state budget.
This funding of the UC system noted here is but a small portion (perhaps %25) of the
revenue sources for the funding of the UC system.
It would be informative to get numbers of students, numbers of employees,
and CA state population in this table.
| Inflation adjusted to constant 2009 dollars, values are 1,000s of dollars | |||||||
|---|---|---|---|---|---|---|---|
| Year | UC system | Comm Colleges | CSU | Student Aid | Higher Education | Full State Budget | CPI Inflation multiplier |
| 1984-85 | 2,999,240 | 2,300,519 | 2,877,918 | 186,936 | 8,397,781 | 52,942,918 | 205.83 |
| 1985-86 | 3,262,959 | 2,327,282 | 3,038,763 | 210,241 | 8,979,302 | 57,322,099 | 198.75 |
| 1986-87 | 3,489,387 | 2,397,484 | 3,115,114 | 218,767 | 9,336,657 | 61,403,181 | 195.12 |
| 1987-88 | 3,555,927 | 2,465,926 | 3,228,597 | 222,417 | 9,581,166 | 62,163,897 | 188.26 |
| 1988-89 | 3,740,587 | 2,754,668 | 3,406,065 | 245,334 | 10,287,685 | 68,159,286 | 189.87 |
| 1989-90 | 3,581,523 | 2,681,172 | 2,813,841 | 263,201 | 9,600,292 | 68,047,719 | 172.47 |
| 1990-91 | 3,494,578 | 2,838,670 | 2,705,364 | 262,883 | 9,601,278 | 65,881,007 | 163.62 |
| 1991-92 | 3,306,086 | 2,664,538 | 2,566,233 | 270,257 | 9,141,796 | 68,030,721 | 157.02 |
| 1992-93 | 2,863,390 | 1,948,590 | 2,271,245 | 222,320 | 7,642,884 | 62,416,241 | 152.43 |
| 1993-94 | 2,653,948 | 1,459,876 | 2,149,354 | 311,862 | 6,873,744 | 57,656,841 | 148.00 |
| 1994-95 | 2,634,083 | 1,723,383 | 2,277,266 | 326,198 | 7,310,630 | 60,551,051 | 144.30 |
| 1995-96 | 2,691,021 | 2,066,518 | 2,286,852 | 332,246 | 7,711,309 | 63,698,194 | 140.33 |
| 1996-97 | 2,804,040 | 2,363,445 | 2,467,113 | 359,647 | 8,385,405 | 66,907,065 | 136.30 |
| 1997-98 | 2,905,207 | 2,614,219 | 2,494,867 | 393,337 | 8,786,741 | 70,452,471 | 133.25 |
| 1998-99 | 3,303,330 | 2,812,947 | 2,774,143 | 450,554 | 9,742,686 | 75,869,399 | 131.20 |
| 1999-00 | 3,486,089 | 3,083,019 | 2,792,429 | 494,692 | 10,333,099 | 85,355,121 | 128.37 |
| 2000-01 | 3,975,811 | 3,295,026 | 3,032,917 | 605,349 | 11,406,321 | 96,934,032 | 124.19 |
| 2001-02 | 4,071,046 | 3,268,378 | 3,244,144 | 656,862 | 11,693,151 | 92,681,696 | 120.76 |
| 2002-03 | 3,775,839 | 3,255,322 | 3,207,430 | 676,431 | 11,277,787 | 92,107,293 | 118.88 |
| 2003-04 | 3,372,010 | 2,651,367 | 3,051,740 | 781,105 | 10,214,964 | 88,718,940 | 116.23 |
| 2004-05 | 3,055,647 | 3,453,667 | 2,802,894 | 674,075 | 10,488,261 | 92,625,553 | 113.21 |
| 2005-06 | 3,118,931 | 3,927,260 | 2,842,662 | 805,352 | 11,204,125 | 100,294,222 | 109.50 |
| 2006-07 | 3,261,642 | 4,248,094 | 2,978,685 | 843,144 | 11,870,330 | 107,578,547 | 106.08 |
| 2007-08 | 3,359,748 | 4,301,316 | 3,063,973 | 893,893 | 12,194,324 | 106,221,235 | 103.14 |
| 2008-09 | 2,434,128 | 3,723,076 | 2,170,891 | 891,104 | 9,867,721 | 90,740,005 | 99.33 |
| 2009-10 | 2,654,061 | 3,851,038 | 2,317,952 | 717,125 | 10,344,916 | 83,524,166 | 100.00 |
