File:SizeVsTime.png
From genomewiki
Jump to navigationJump to search
Size of this preview: 800 × 533 pixels. Other resolution: 1,200 × 800 pixels.
Original file (1,200 × 800 pixels, file size: 156 KB, MIME type: image/png)
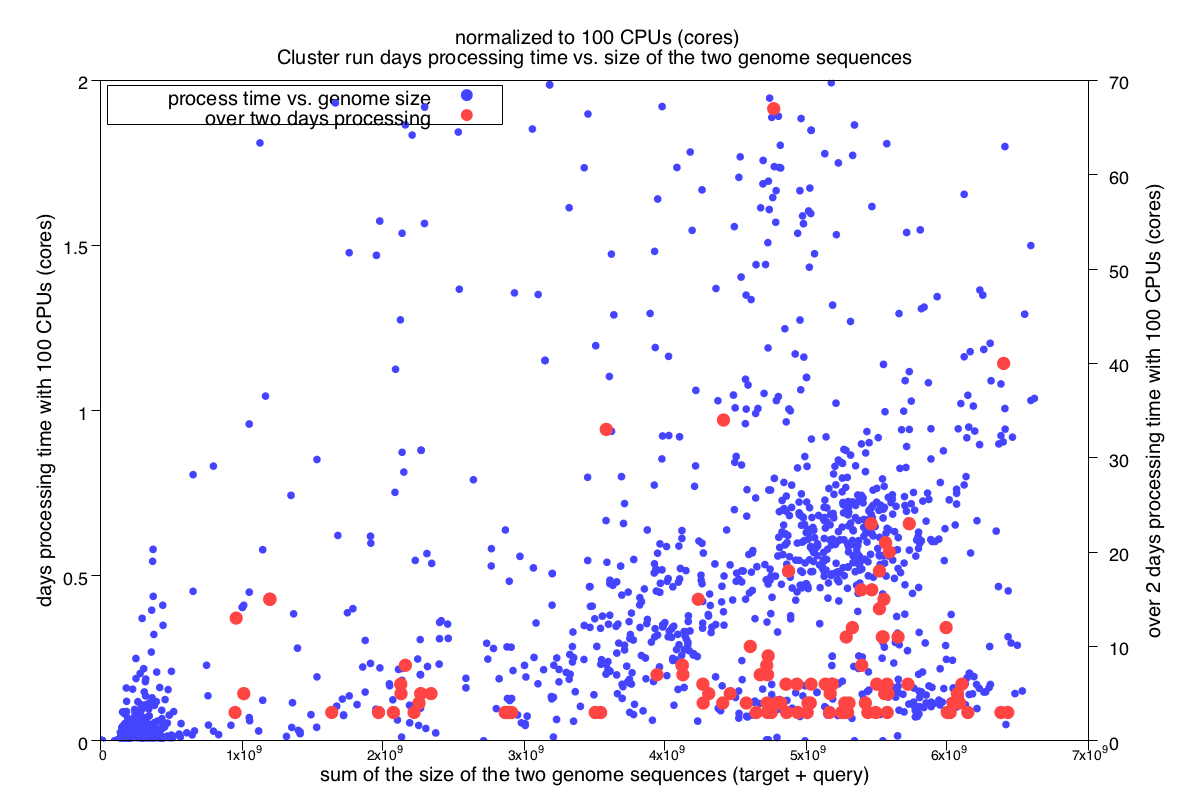
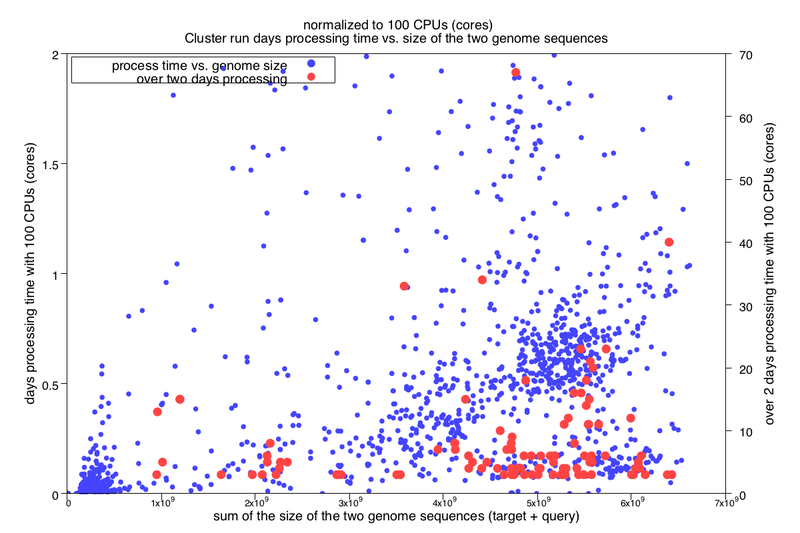
lastz cluster run processing time vs. genome size
blue points plot times 2 days or less processing time, left axis scale 0 - 2 days
red points plot times over 2 days processing time, right axis scale 0 - 70 days
high contig count assemblies (hundreds of thousands of contigs) and poorly repeat masked assemblies will cause longer run times
File history
Click on a date/time to view the file as it appeared at that time.
| Date/Time | Thumbnail | Dimensions | User | Comment | |
|---|---|---|---|---|---|
| current | 23:13, 27 April 2018 | | 1,200 × 800 (156 KB) | Hiram (talk | contribs) | lastz cluster run processing time vs. genome size blue points plot times 2 days or less processing time, left axis scale 0 - 2 days red points plot times over 2 days processing time, right axis scale 0 - 70 days |
You cannot overwrite this file.
File usage
The following page uses this file: